I tracked the 26th Jan Farmer Protests through Snapchat
Table of Contents
Introduction
What is OSINT?
OSINT stands Open-Source Intelligence, which is a practice of collecting information through publicly available resources. You can read more about it here.
There are a lot of tools and methodologies which go into an OSINT research, but during the protests I decided to use a powerful social media tool which was able to track the movement of all the protesters in real time and provide live photos and videos of what was happening on ground. The tool in question is Snap Maps.
Brief Overview
On 26th January, the Republic Day of India, farmers primarily from Punjab, Haryana and U.P organized a tractor rally in the capital of India, Delhi to protest against the agri-bills the current government aims to codify into laws. But things quickly turned south and protests turned violent as the day went on.
As a security student who happened to be reading about Open-Source Intelligence (OSINT) research recently, I tried to apply the thought process of OSINT in order to follow and track the movement and activity of the protesters. This led me to some insights:
- The movement of the farmers throughout the day
- Snap Map as a tool to track large crowds, visually
- A large demographic of Snapchat users in North India being rural Punjabi youth
Enough exposition, let’s dive in.
EDIT: November 2021
It seems that Snapchat only allows you to view SnapMaps history to a certain period of time. Hence, it has stopped showing the SnapMaps over Delhi of Jan 26th, but rather some arbitrary date and time. Had I known this, I would have stored or documented this blog better. So currently, the Snapchat Map embeds have been taken down, so do bear with me! I’m still leaving this up and have added some screenshots which I managed to scrape off Snapchat in the end.
The Farmer’s Movements Through Snap Maps
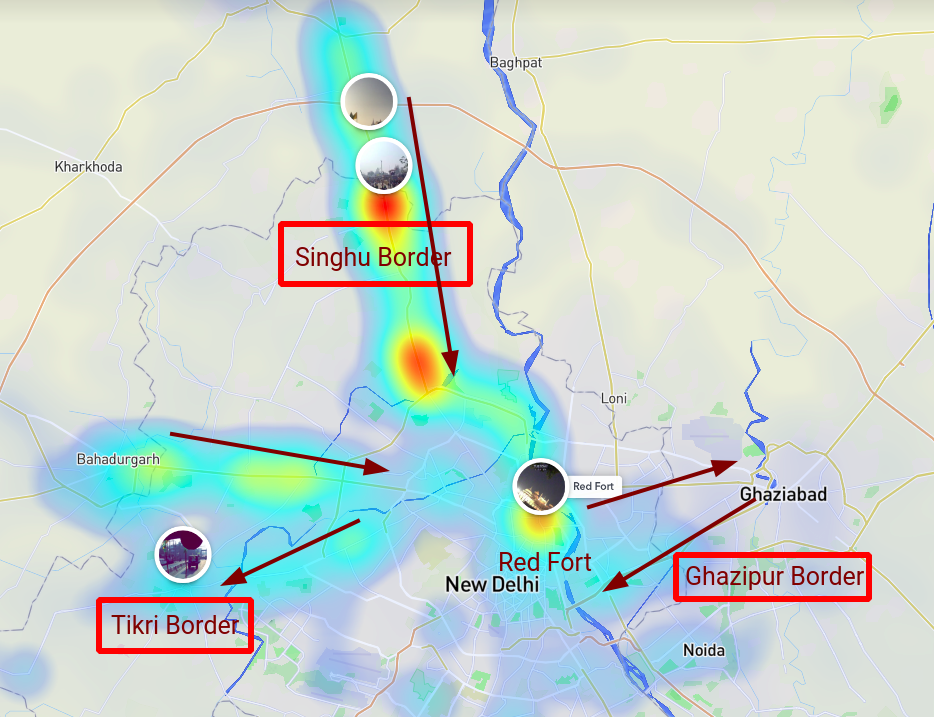
If you look at Delhi through the Snap Maps, you immediately notice the heat map Snapchat overlays on top of Delhi giving a sense of the Snapchat activity in the area.
Feel free to use Ctrl and Scroll to navigate through these maps and view public Snapchat stories
With this heat map, one can really see the concentration of the population as a whole. Now not everyone is a Snapchat user, but if enough people are, you can really see the movement of everyone in Delhi. This is what happened in the Farmer protests.
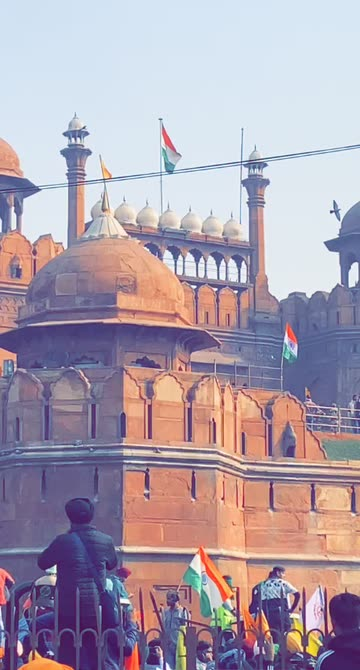
Throughout 26th January, Snap Maps showed a live map of the movement of the farmers from the Singhu, Ghazipur and Bahadurgarh borders into Delhi where they breached the barricades and entered the Red Fort complex and hoisted flags.
Here is the original route that was supposed to be followed.
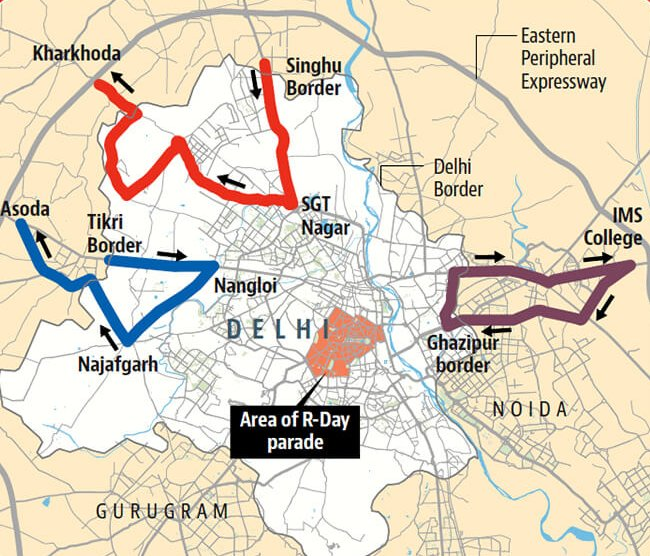
Image taken from Hindustan Times
7:00 am - 10:00 am
Between this time period we can see that most of the activity is concentrated in the Singhu Border and the other borders are quite dormant
10:00 am - 1:00pm
Farmers started mobilizing along the Singhu Border as more and more farmers arrived here from up north. Meanwhile, Bahadurgarh Border also gets more concentrated.
1:00pm - 4:00pm
This is the most active time period. Farmers divert from approved roads and breach into Red Fort. One can easily see the movement of Singhu protesters from NH-44 and Ghazipur protesters from NH-25 into the Red Fort.
4:00pm - 7:00pm
Below one can now see the two new hotspots in Delhi, the Najafgarh border and Red Fort. Around this time, the government shut down internet connectivity in a lot of regions as a method of crowd control.
EDIT: Some screenshots
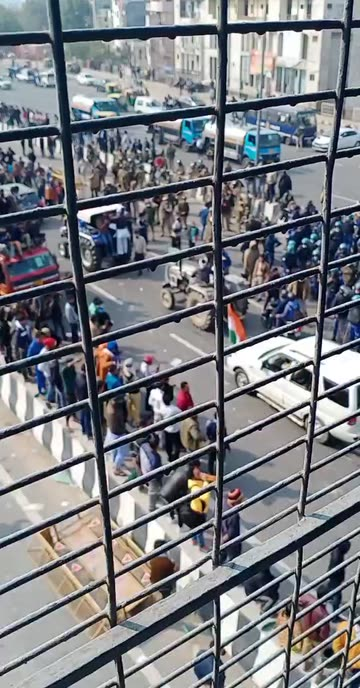
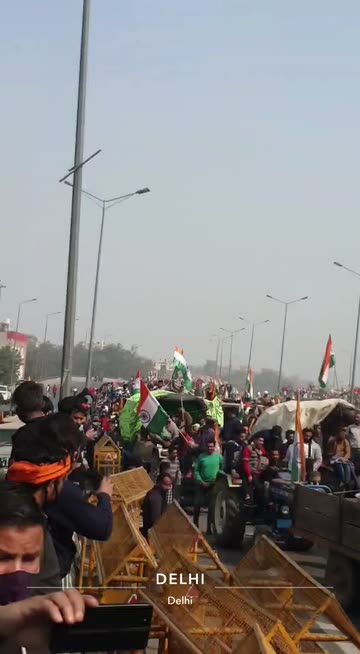
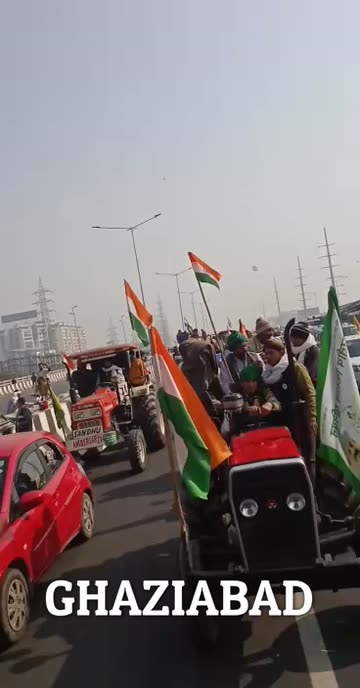
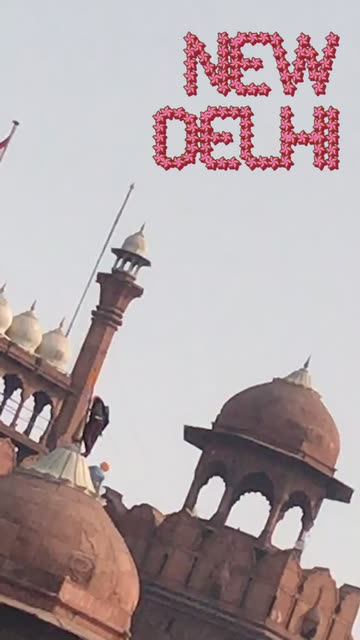
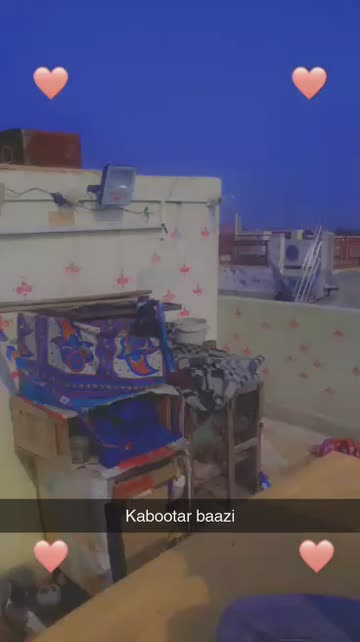
As mentioned above, SnapMaps doesn’t work anymore but while documenting I managed to scrape some photos uploaded to public Snapchat stories. I do apologize for not documenting it better.
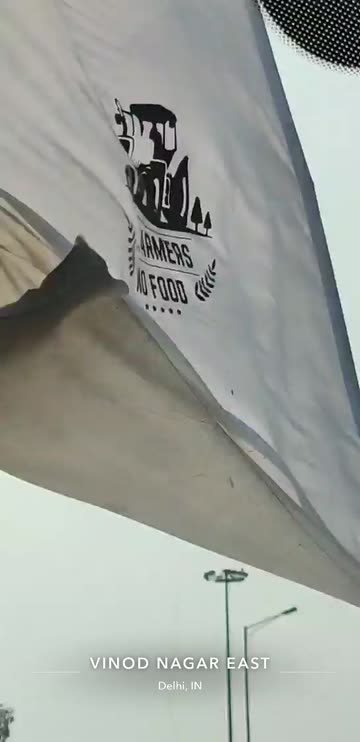
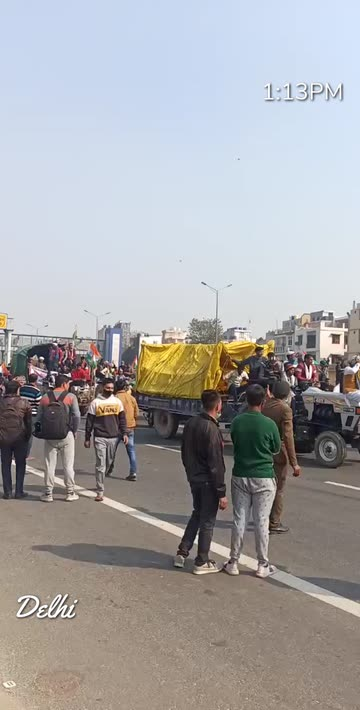
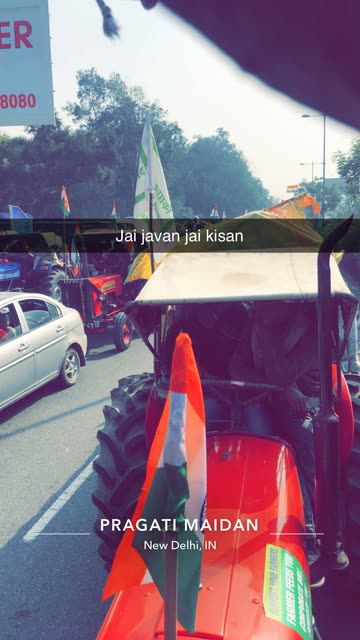
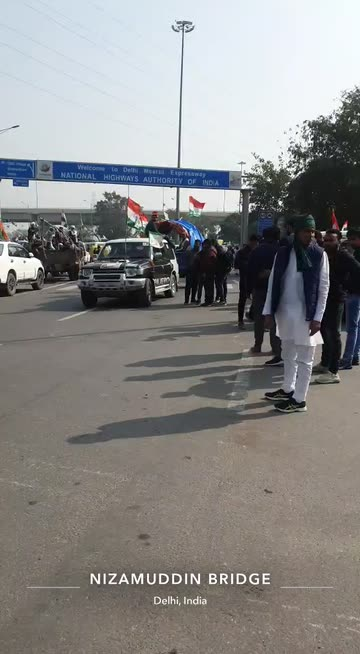
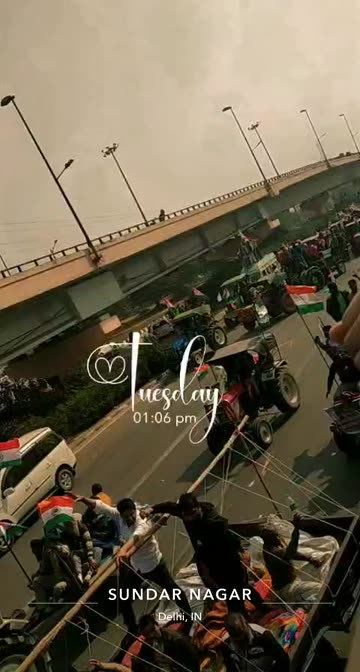
Snapchat filters with their timestamps really made tracking them easier!
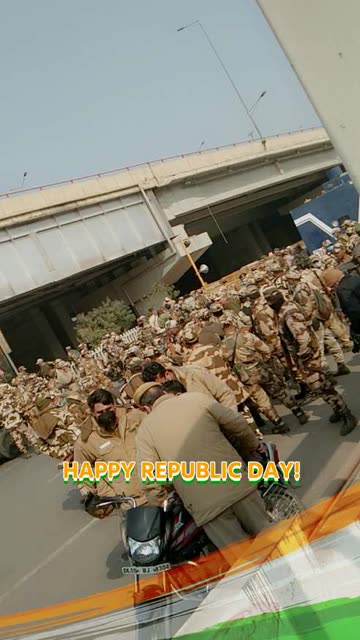
This picture is probably one of my favourites!
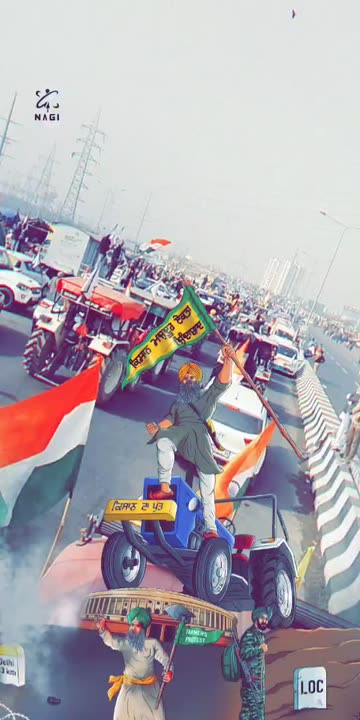
Ah! The stickers and the filters…
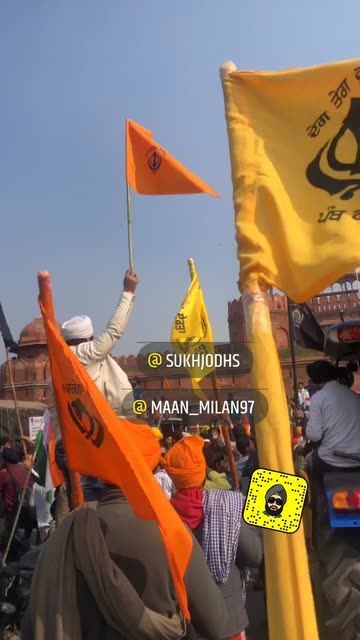
Thanks for tagging and identifying yourself!
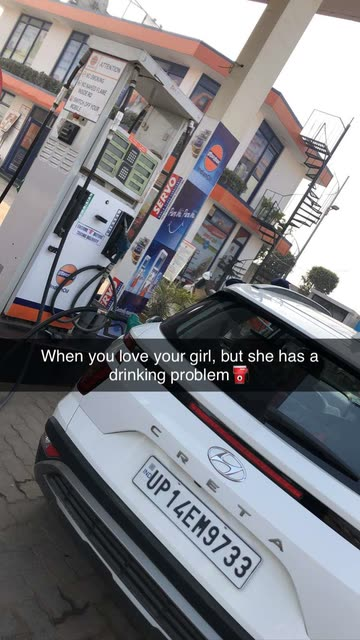
Some unrelated favs

Republic Day 2021 was an extremely important day for starving PUBG players too! #NeverForget
Don’t know what this means and I don’t want to either
Conclusion and Analysis
Snap Maps is a powerful tool to track large crowds and their activity. Viewing these Maps live as events were unfolding was even more intriguing than this, as Snapchat archives a lot of the public stories and only restricts viewing past Snap Map activity to three hour intervals.
While one could see (and potentially scrape) a lot of movement and activity through Snap Maps, how much one can track and see depends on
- The number of active Snapchat users in the demographic
- The internet connectivity of the region
Viewing India’s entire Snap Map hotspots down below we get some interesting insights.
Most of the Snapchat users in India are concentrated in;
- Punjab
- Hyderabad
- New Delhi
- Mumbai
It is clear that Punjab has the largest concentration of Snapchat users in India
Hence, if any skirmish is to break out in these regions, it would be quite easy to track through Snapchat, Snap Map and public stories. Applying the same logic to the Delhi Farmer Protests with the knowledge that most of the protesters are Punjab farmers, we can conclude that is why it was so visible through Snap Maps. And that is why the north region of Delhi, which was the entryway for Punjab farmers to protest was such a hotspot.
Moreover, as of writing this blog, the focus of the protests have shifted from Singhu to Ghazipur, yet looking at the map one can barely make out whether there is a large gathering of people or not.
This leads me to the conclusion that a majority of Snapchat’s Indian user base consists of rural Punjabi youth.